|
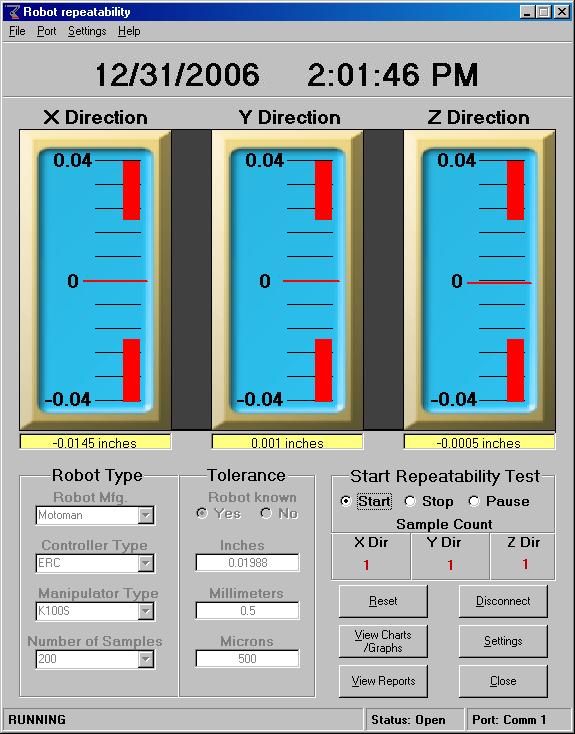
Quick View |
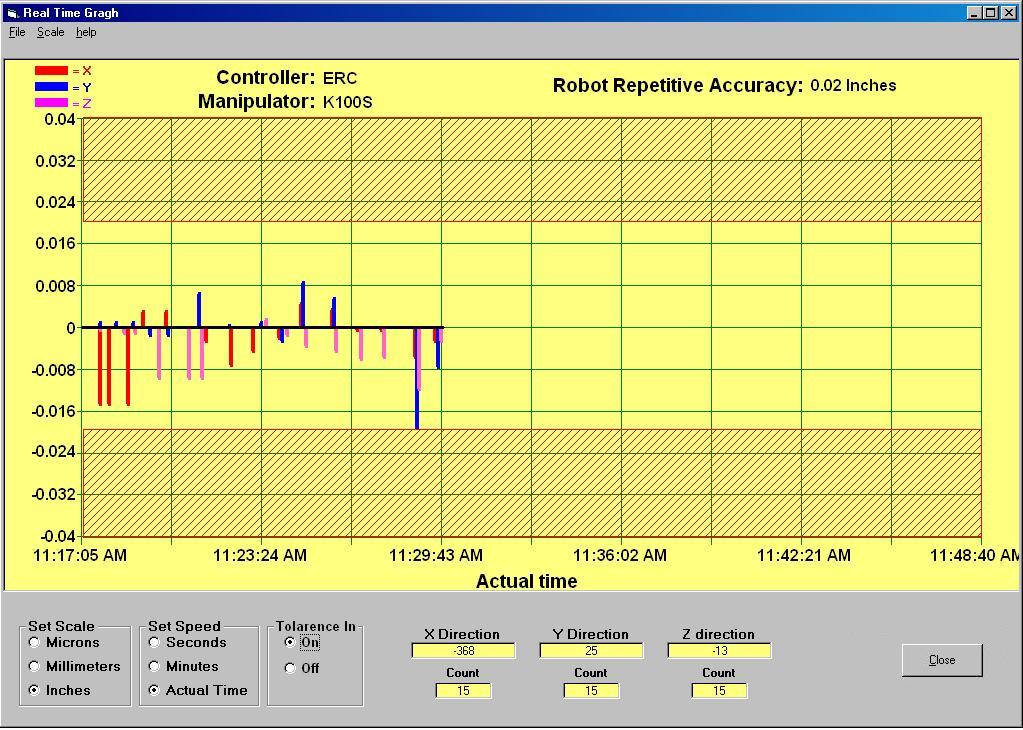
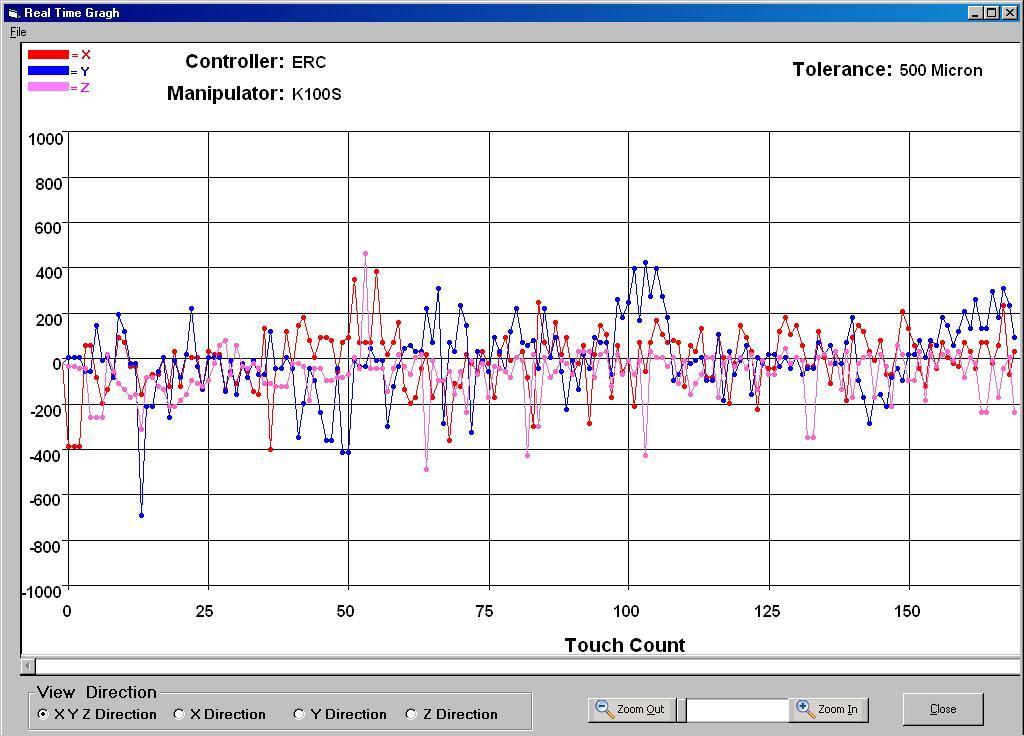
Real Time Chart |
|
|
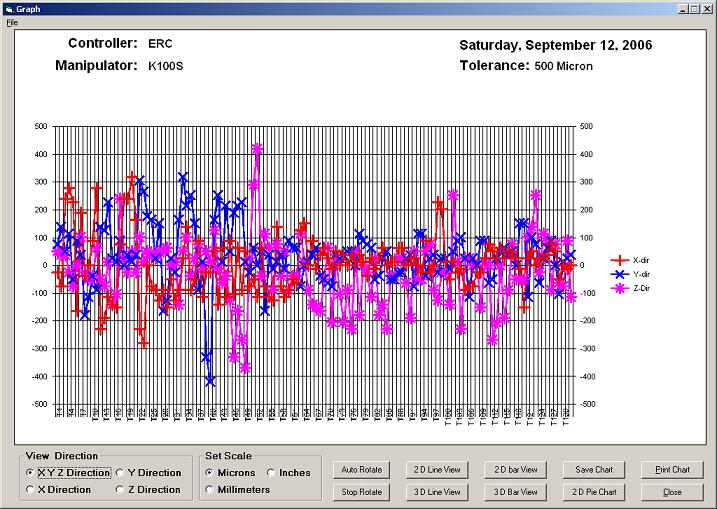
Plot Graph |
Reports |
|

Repetitive Positioning Accuracy Tester
Robots are rated based on their maximum payload, maximum reach and their repetitive positioning accuracy. Repetitive position accuracy is the allowable tolerance of a robots ability to repeatedly return to a taught position in its work envelope.
The Repetitive Positioning Accuracy tester checks the repeatability accuracy of the robot manipulator in the X, Y, and Z direction. The Repetitive Positioning Accuracy tester uses three digital dial indicators to send the actual position of the manipulator compared to the taught position. The digital dial indicators used depends on the accuracy required for a particular manipulator. The dial indicators can be floor mounted, magnetic stand mounted, or movable base mounted, depending on the users application, floor space restraints and size of the robot being tested. The Repetitive Positioning Accuracy tester is designed to:
- Verify Manipulator Positioning Accuracy after Rebuild
- Troubleshoot Repeatability issues during Production
- Track Axis wear during Preventive Maintenance Program
Verify Positioning Accuracy after Rebuild
The Positioning Accuracy Tester will verify that the robot manipulator meets the manufactures specification when the robot was originally manufactured. This can be a great marketing tool when selling used robots.
Troubleshoot Repeatability Issues
The most common cause of repeatability issues are worn or loose axis drives. When a Rotary Vector or Harmonic drive fail it is easily identified and replaced, but when a rotary vector or harmonic drive begins to wear the backlash increases causing repeatability issues. The Repetitive Positioning Accuracy tester helps identify the correct axis causing the issue, and used in conjunction with our Drive Deflection Calculator program (free download; found in the download section) the worn drive is quickly and easily identified and replaced.
Track Axis Wear during Preventive Maintenance Program
Unscheduled downtime is the biggest offender of manufacturing. It can be very expensive and time consuming. By tracking the repeatability variations of a robot, it can be easy to predict the end of life for the motor drivers and allow time to schedule downtime to repair or replace the drive.

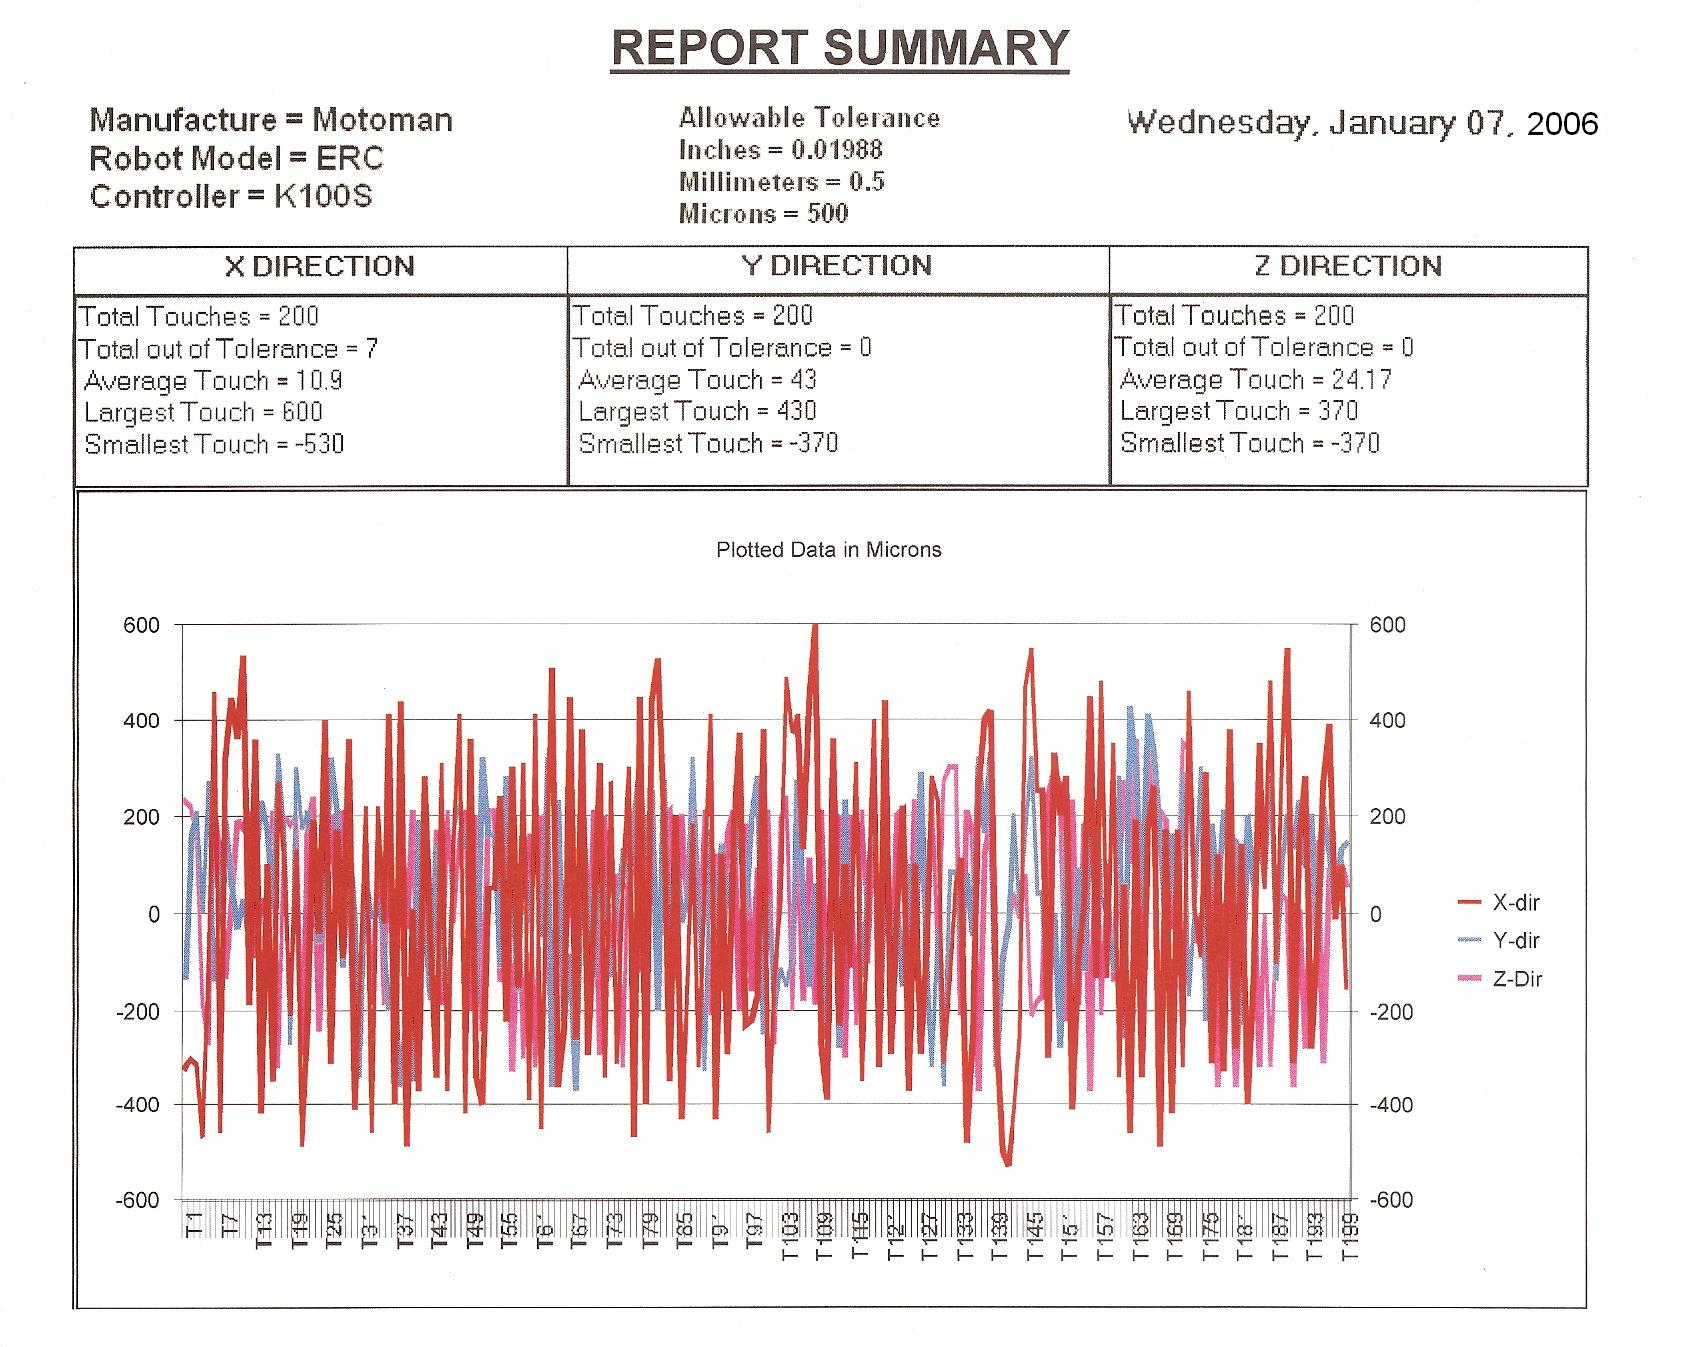
Repetitive Positioning Accuracy Software
The custom software allows for rapid set-up and execution of the Repetitive Positioning Accuracy test. The database includes over 1000+ robot manufacturers manipulators / controllers (Motoman, Fanuc, and ABB - to name a few) and their respective tolerances in millimeters, microns and inches. If the required manipulator is not in the database it can easily be added for future use. The touch results can be viewed in real time on the quick view screen (shown below) or in the real time chart. The results can be viewed in a 2 or 3 dimensional graph and can be rotated to any direction. There are two types of reports than can be viewed and printed. They are the Summary report and the Detailed Analysis Report.
